Bitcoin Price Analysis Dec.27: BTC Sideways Action Will Breakout Soon?
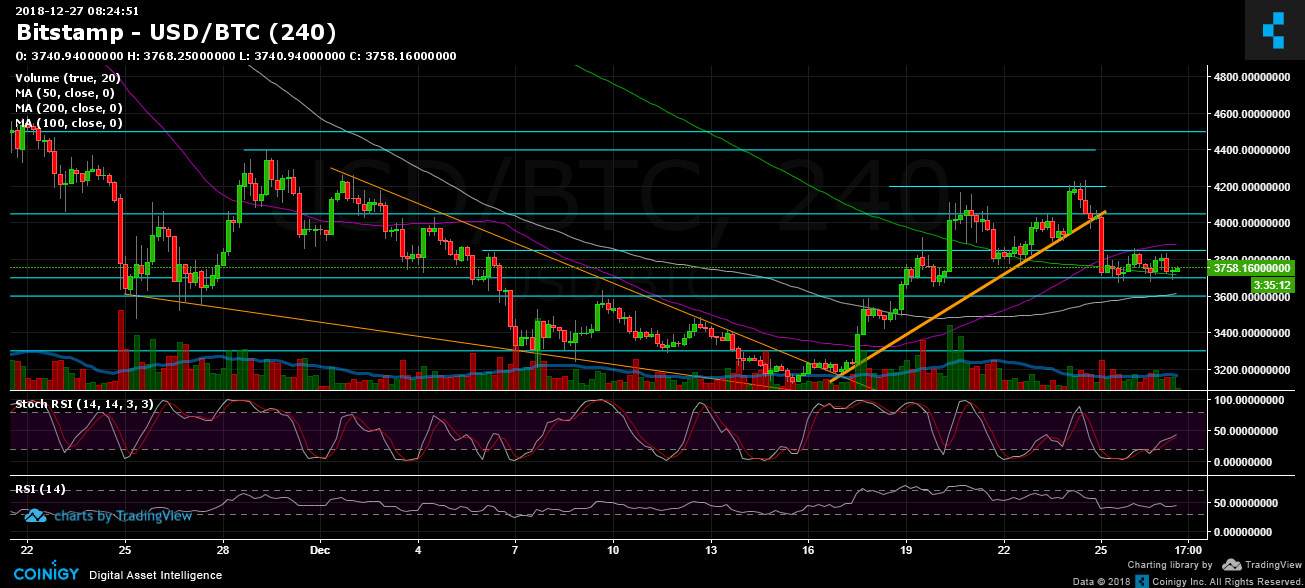
Holidays are well-felt on the crypto charts as both the volume and the volatility are very low. Over the past two days since our recent BTC price analysis Bitcoin is moving sideways between $3700 and $3850, the two levels we have mentioned here as support/resistance.
It turned out that the two above levels correlate with the 50 days moving average line from above (marked purple on the 4-hour chart) and the 200 days moving average line from below (marked in light blue).
We can assume that as the holiday’s mood disappears, we would see some action and a breakout from the above range.
Looking at the 1-day & 4-hour charts
- In the case of breaking down the $3700 support, the next significant support lies at $3600 along with MA-100 (4-hour chart). Below there is the $3480 support level. As mentioned on the weekly market update, $3600 is an essential level of support.
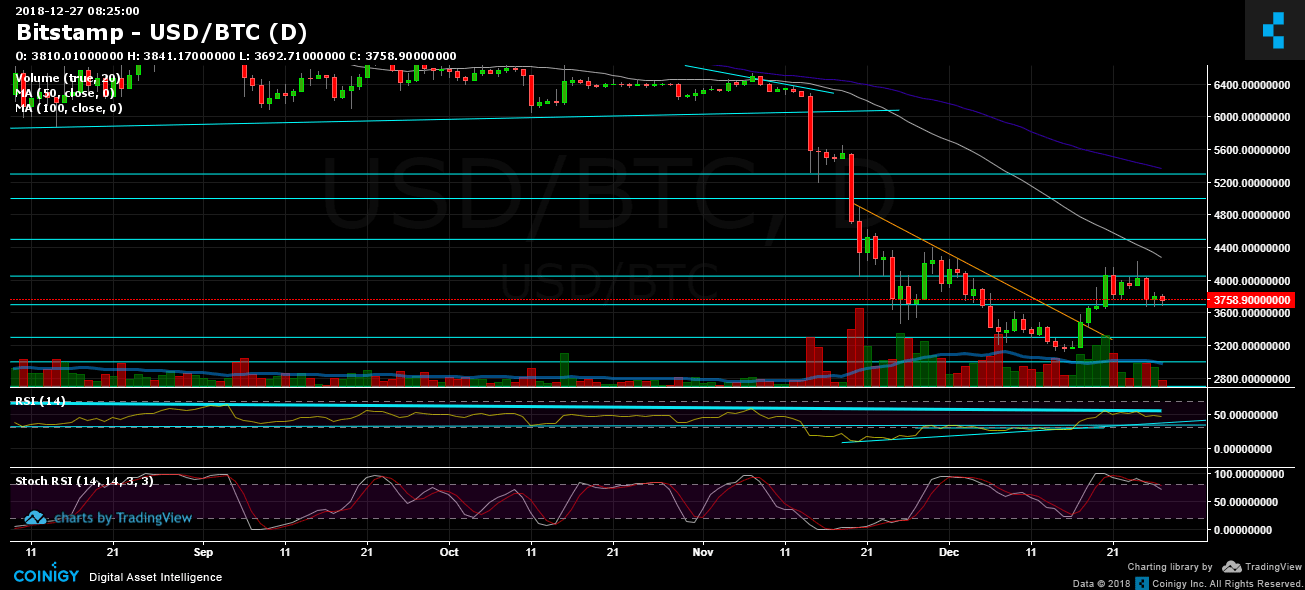
- In the case of breaking up the $3850, the next resistance levels are $3900, $4050 and $4200 (along with the daily chart’s 50 days moving average line – marked white).
- Looking on the daily chart’s RSI: The RSI couldn’t break up and had been rejected by the descending line. We could expect the RSI to test prior support on the ascending line. A bullish confirmation will be when the RSI succeeds in breaking up that descending trendline resistance.
- Stochastic RSI oscillator of the daily chart had crossed over around the overbought level. This supports the option of breaking down the $3700 – $3850 range.
- As mentioned already, the trading volume is relatively low, likely because of the holidays.
- BitFinex’s open short positions had decreased to 31K BTC. This is the monthly low. It could be from the above reason as well (holidays), but keep in mind – when shorts are at their peak expect a short squeeze. When shorts are at the bottom, expect a long squeeze.
BTC/USD BitStamp 4-Hour chart

BTC/USD BitStamp 1-Day chart

The post Bitcoin Price Analysis Dec.27: BTC Sideways Action Will Breakout Soon? appeared first on CryptoPotato.


